Narcissus effect while perceiving own face via EEG
TL;DR
The EEG shows self-specific reductions (desynchronization) in both alpha and beta power in those time windows, suggesting more active cortical engagement when processing one’s own face compared to familiar or unfamiliar faces.
- Self-face shown →
- Alpha & beta power drop (event-related desynchronization, ERD) →
- Neurons fire in a less synchronized, more variable way →
- This loosening of rhythm is a sign that those brain areas are actively processing incoming info instead of idling →
- That usually means more attention and cognitive resources are engaged for the Self condition compared to Friend or Unknown.
So:
Self images → alpha/beta decrease → less synchrony → more processing → more attention
- Self-face → alpha ERD + beta ERD → consistent with greater attention + self-processing.
3.2. EEG results
Having demonstrated a self-bias at the behavioural level, we then carried out a time-frequency analysis of the EEG signal to identify self-specific effects at the neural level. The cluster-based permutation F-test revealed an effect among experimental conditions – Self, Friend, and Unknown (p = 0.004). This corresponded to a cluster in the observed data around the alpha (8–13 Hz) and beta (13–30 Hz) range (see Fig. 3A). Contrary to our expectations, we did not observe any significant effect in the gamma band.
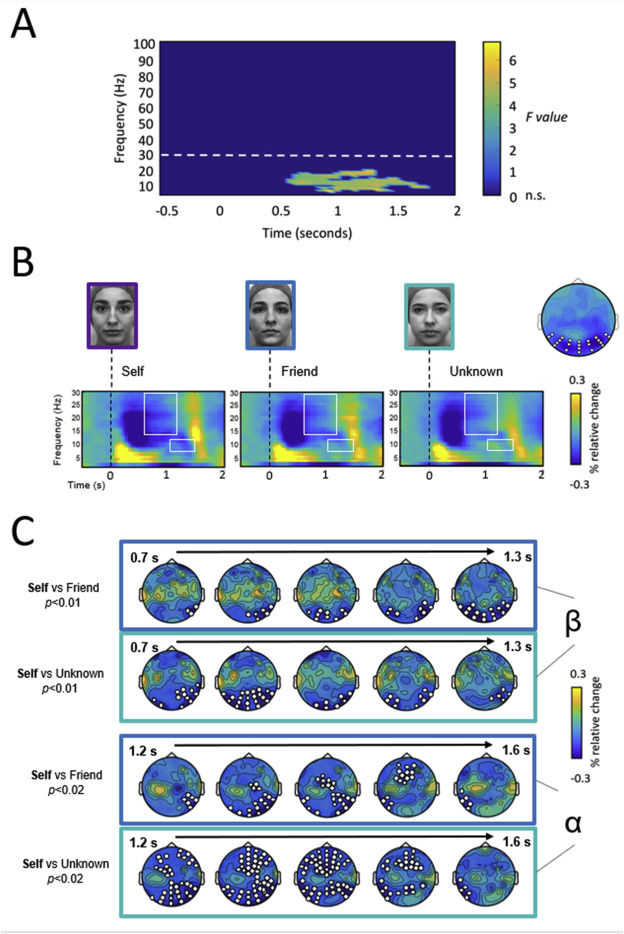
Fig. 3. Top-down attentional modulation during self-face processing. (A) Time-frequency representation of the F-value collapsed across electrodes for all of the time-frequency ranges (−0.5 to 2 s, and 2.5–100 Hz). (B) Time-frequency power maps (from 2.5 to 30 Hz) of the three experimental conditions (Self, Friend and Unknown faces). These represent the average time-frequency activity of the group of electrodes showing the largest differences between conditions. The mean topography of all differences between conditions in the alpha-beta range is shown on the right side; selected electrodes employed to compute time-frequency maps are highlighted in white. Alpha and beta frequency bands exhibited a power suppression that was greater and more sustained after self-face presentation. White squares indicate time-frequency windows for significative clusters found in the observed data (beta: 0.7–1.3 s at 13–30 Hz; alpha: 1.2–1.6 s at 8–13 Hz). (C) Topographies of power differences in the alpha and beta bands between conditions. Electrodes for each cluster are highlighted in white.
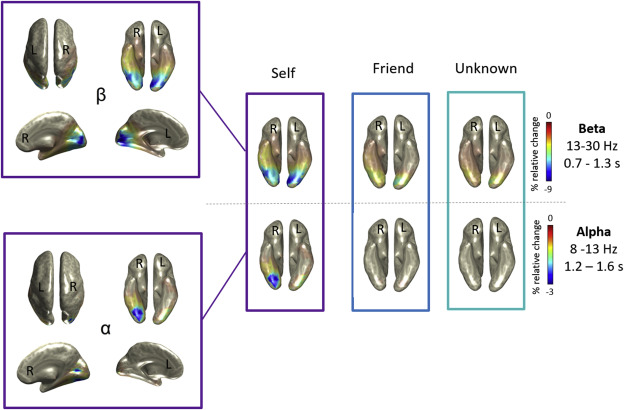
Fig. 4. Brain regions underlying the attentional modulation induced by the self-face. The figure shows the neural generators of beta (top) and alpha band (bottom) power suppression for the three experimental conditions (Self, Friend and Unknown faces) during time ranges of interest (0.7–1.3 s for beta, and 1.2–1.6 s for alpha). The beta source was more broadly distributed over the entire visual cortex, whilst the alpha band was generated around face-related areas in the right hemisphere.
source: https://www.sciencedirect.com/science/article/pii/S105381192030241X