👨🤖 EEG responses to the Real vs Virtual faces
Are you for real? Decoding realistic AI-generated faces from neural activity
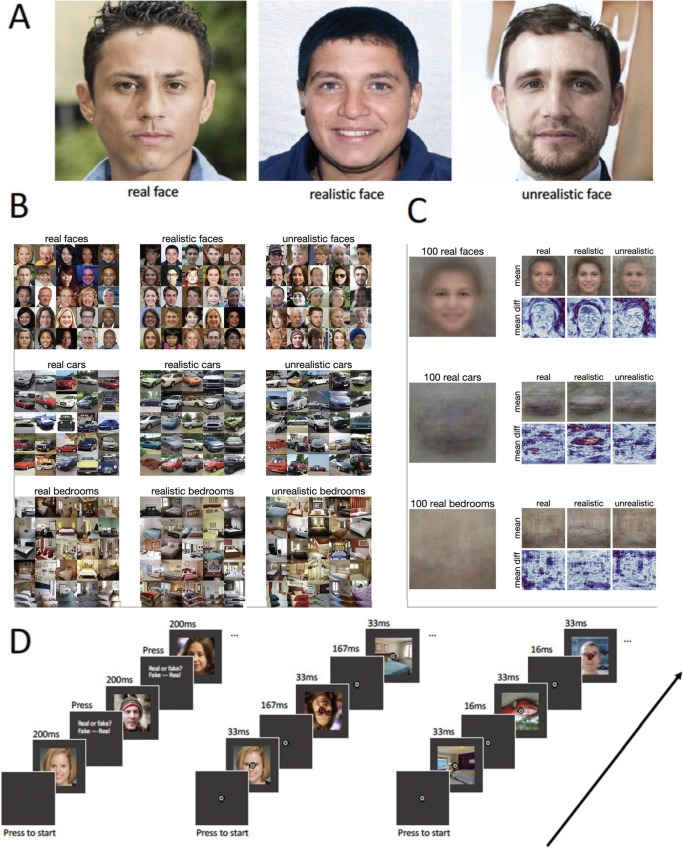
Decoding for unrealistic faces displayed a triple peak pattern, emerging at around 100 ms and maintained until around 370 ms. Early decoding differences are consistent with rapid face detection and face-specific processing (Rossion et al., 2015, Dobs et al., 2019, Crouzet et al., 2010, Wardle et al., 2020). The latter two peaks (at around 170–200 ms and 270–320 ms) have been similarly demonstrated to emerge in real versus artificial face perception (Wheatley et al., 2011, Balas and Koldewyn, 2013, Sagiv and Bentin, 2001, Schindler et al., 2017, Schindler et al., 2019, Wardle et al., 2020). Schindler et al. (2017) suggest that early-stage N170 processing is related to assessing the structural configuration of faces as seen by a greater occipital involvement whilst the later-staged LPP, seen to increase linearly with face realism, suggests a deeper person-related, semantic involvement (also see Abdel Rahman, 2011, Taylor et al., 2016). Differences at the triple peak correspond to N250 and P300 components typically associated with face familiarity (Collins et al., 2018) and semantic information (Tanaka, Curran, Porterfield, & Collins, 2006), the latter especially important for behaviour (Hanso, Bachmann, & Murd, 2010). In contrast, realistic/real decoding displayed a single-peak emergence between around 170 ms to 240 ms indicating a difference in processing between realistic and unrealistic faces. Namely, that differences in perception between real and realistic faces were constrained to the 170 ms time period. Indeed, in comparing human faces to doll faces and artificial faces, others have shown that only the human faces typically evoke sustained neural responses beyond the N170 component necessary for higher-order perception (Balas and Koldewyn, 2013, Wheatley et al., 2011). Balas and Koldewyn (2013) found that the N170 was better characterised by encoding deviations from facial appearance than it was for animacy perception. In other words, realistic faces were perceived as configurally different to real faces, but only unrealistic faces engaged later processing necessary for high-order animacy or familiarity perception. Overall, earlier decoding for unrealistic faces, consistent with apparent low-level image differences (Fig. 1C), suggests that early and low to mid-level processing differences may account for decodability between real and unrealistic faces. The decoding for realistic faces, by contrast, emerges later and is constrained to the 170 ms time period, suggesting a face-specific configural process may be responsible for this distinction.
Real and Deepfake Face Recognition: An EEG Study on Cognitive and Emotive Implications
On the behavioral level, a good deepfake discrimination capacity has been found, which confirmed studies on the recognition of AI-generated faces [13,14,15,16]. Participants had good performance in recognizing the true faces as well [33,34]. A good degree (∼76%) of accuracy in classifying faces was observed, as reported in Table 1 and Table 2. Participants were slightly better at discriminating images with neutral emotional content than images with positive or negative emotional content. It seems to confirm the work of Montagrin et al., which highlighted the important role played by memory in facilitating the recognition of neutral faces in goal-relevant situations [35]. Statistical analysis of PSD-related features highlighted two main significant turn-ons for deepfakes: delta activation in the frontal (Figure 5a and Figure 6a) and right occipital (Figure 4a, Figure 5a and Figure 6a) areas could be due to a dynamic switching attention mechanism [36], meaning that participants spent more time interpreting synthetic faces, whereas high-beta activation in the left temporal area, which includes the FG [37], states that FFA activation is not determined by the originality label of the face presented.
Face Processing in Real and Virtual Faces: An EEG Study
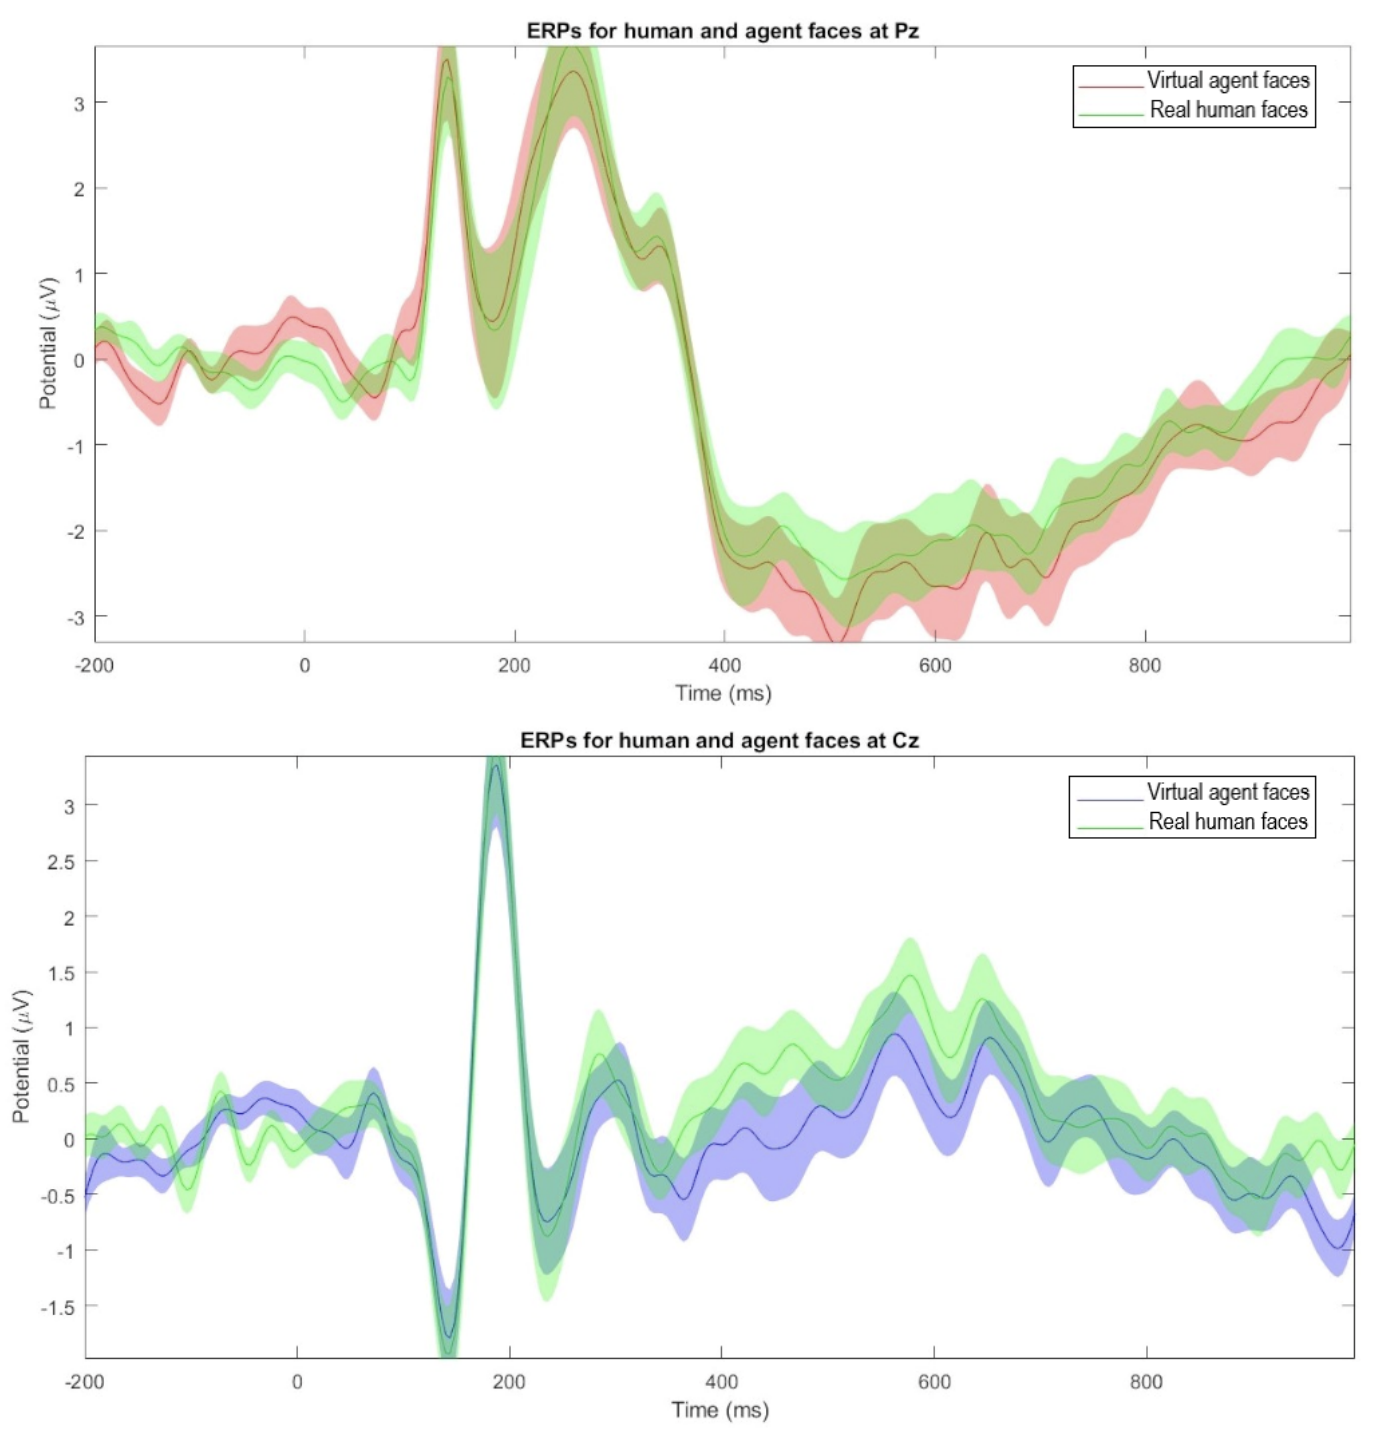
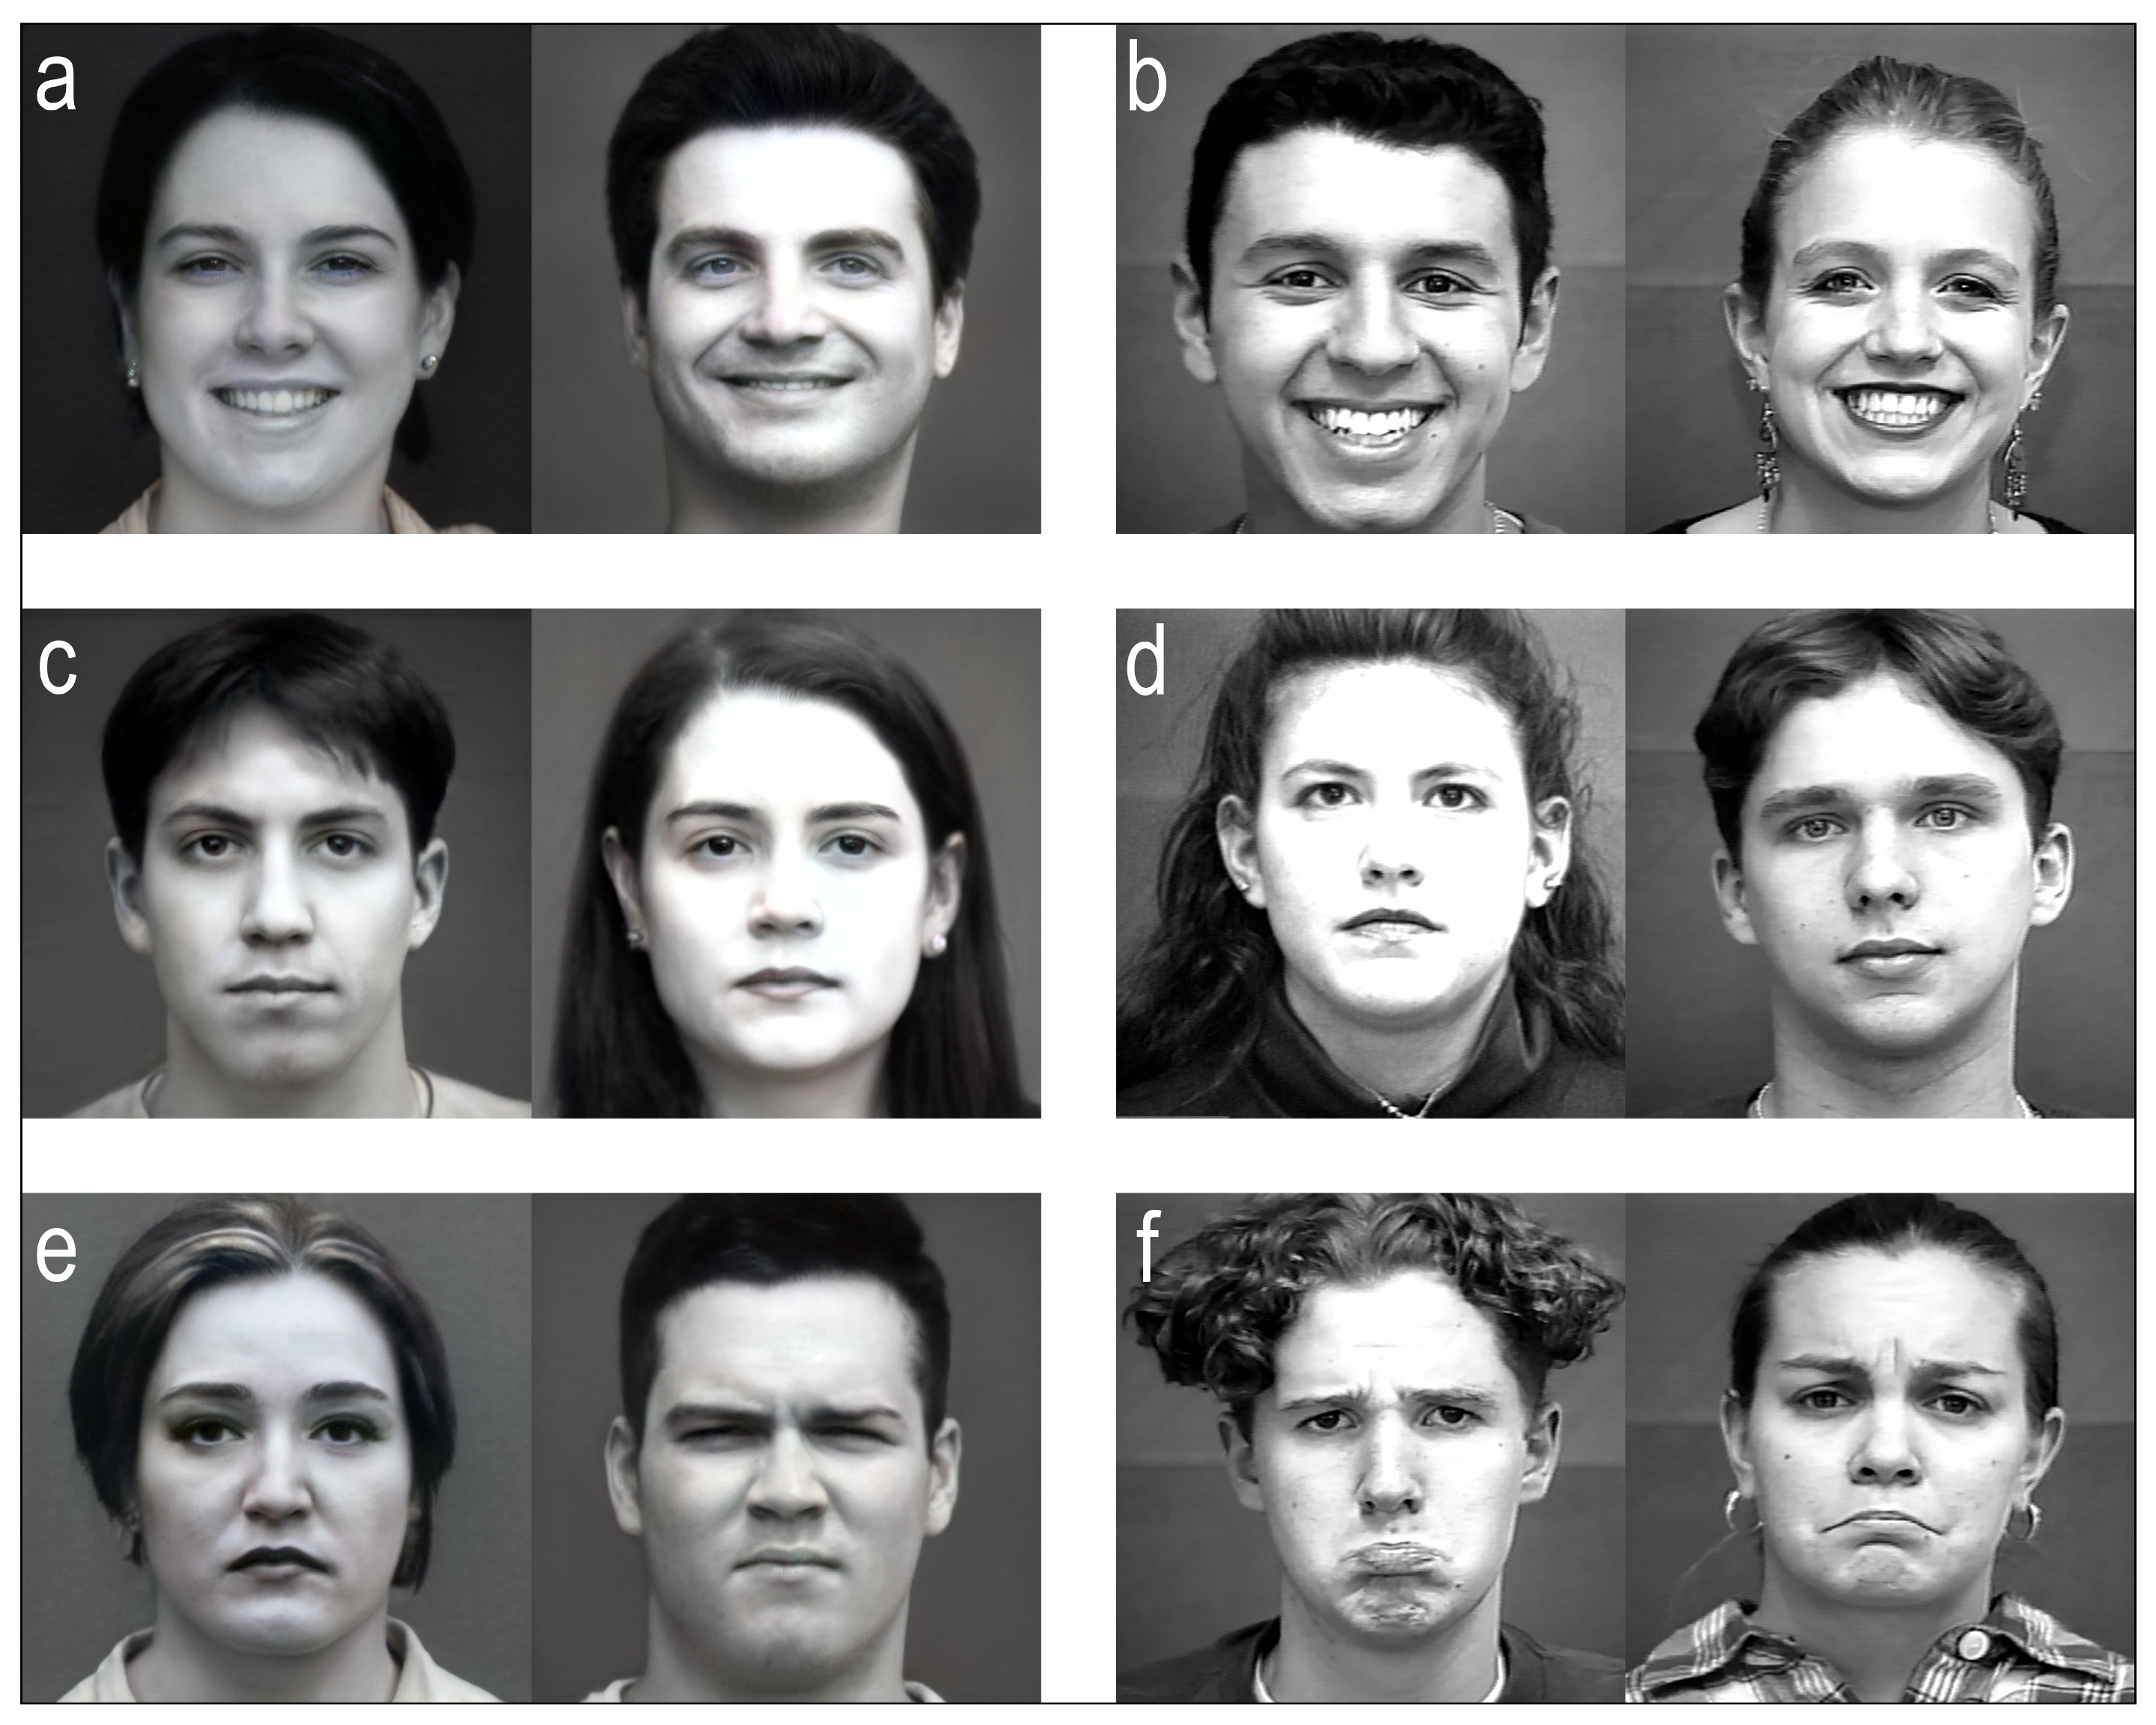
Current EEG results provide evidence that high-quality virtual agent faces elicit an early-stage neural response, represented by the N170 component, that is indistinguishable from the response evoked by real human faces. This suggests that the early stage of face processing is primarily concerned with the presence of a face template rather than minute details or perceptual quality, at least when assessed by N170.
Realness of face images can be decoded from non-linear modulation of EEG responses.
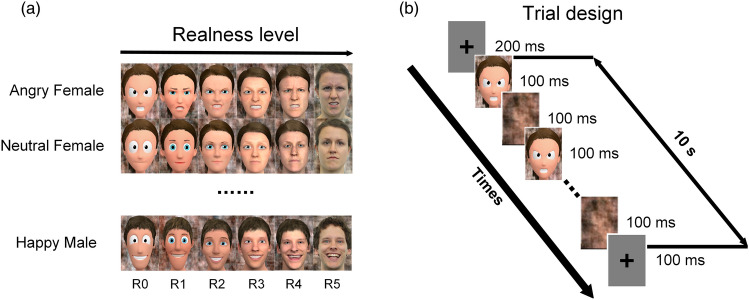
Assessing neuronal responses both in frequency and time domain, we found a non-linear relationship between SSVEP amplitudes and stylization level, that is, the most stylized cartoon images and the real photographs evoked stronger responses than images with medium stylization. Moreover, realness of even highly similar stylization levels could be decoded from the EEG data with task-related component analysis (TRCA). Importantly, we also account for confounding factors, such as the size of the stimulus face's eyes, which previously have not been adequately addressed.
Real-life relevant face perception is not captured by the N170 but reflected in later potentials: A comparison of 2D and virtual reality stimuli
An interesting article in which the authors investigated how EEG responses differ during the perception of real and virtual faces.
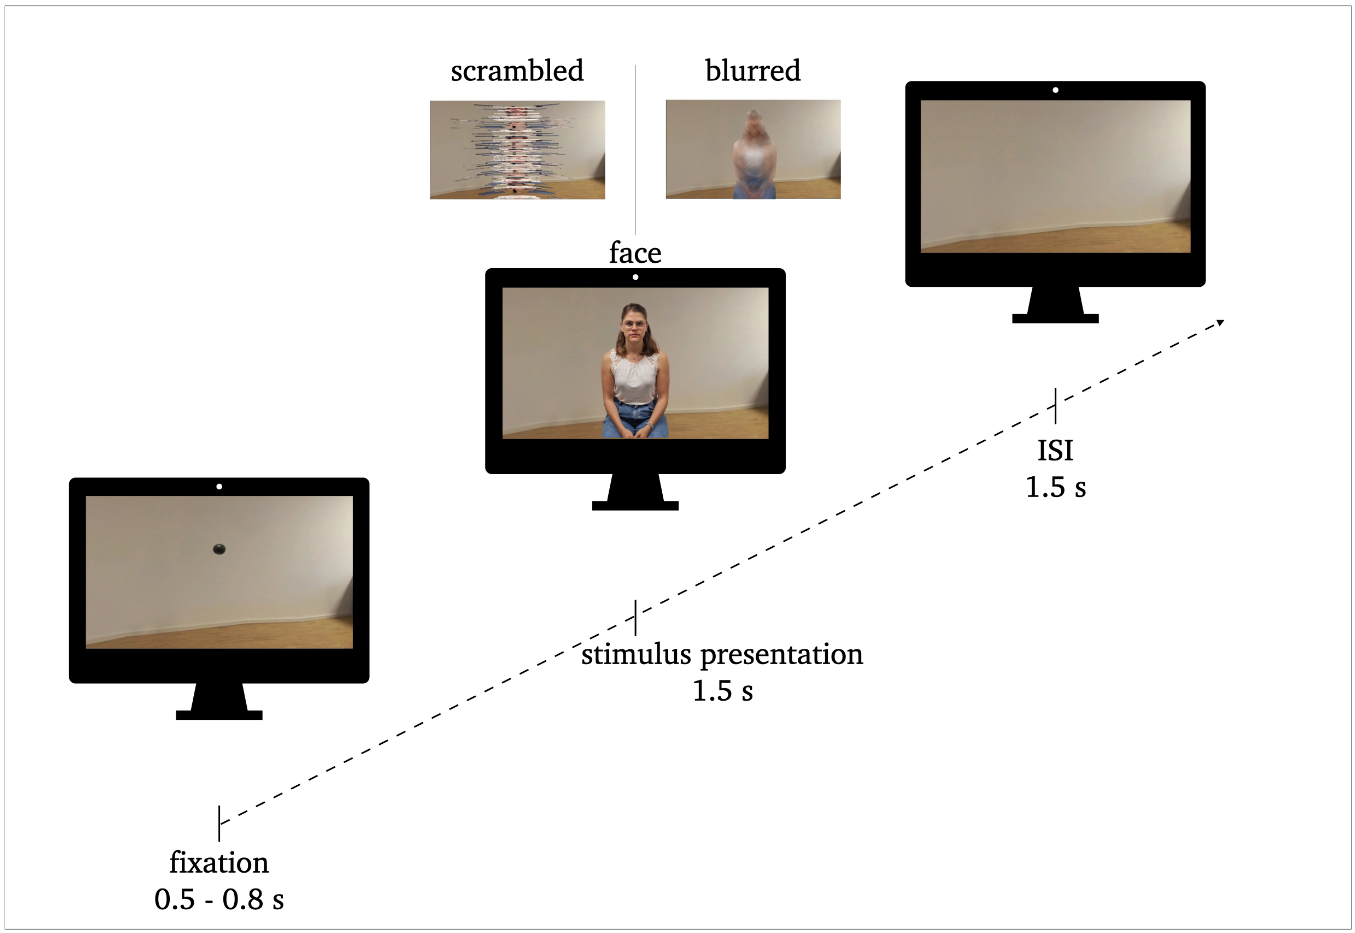
FIG 1. Procedure of stimulus presentation: 0.5–0.8s fixation, 1.5s stimulus presentation, 1.5s inter stimulus interval (ISI). Exemplary stimuli of face conditions and perceptual control conditions (scrambled, blurred) are illustrated.
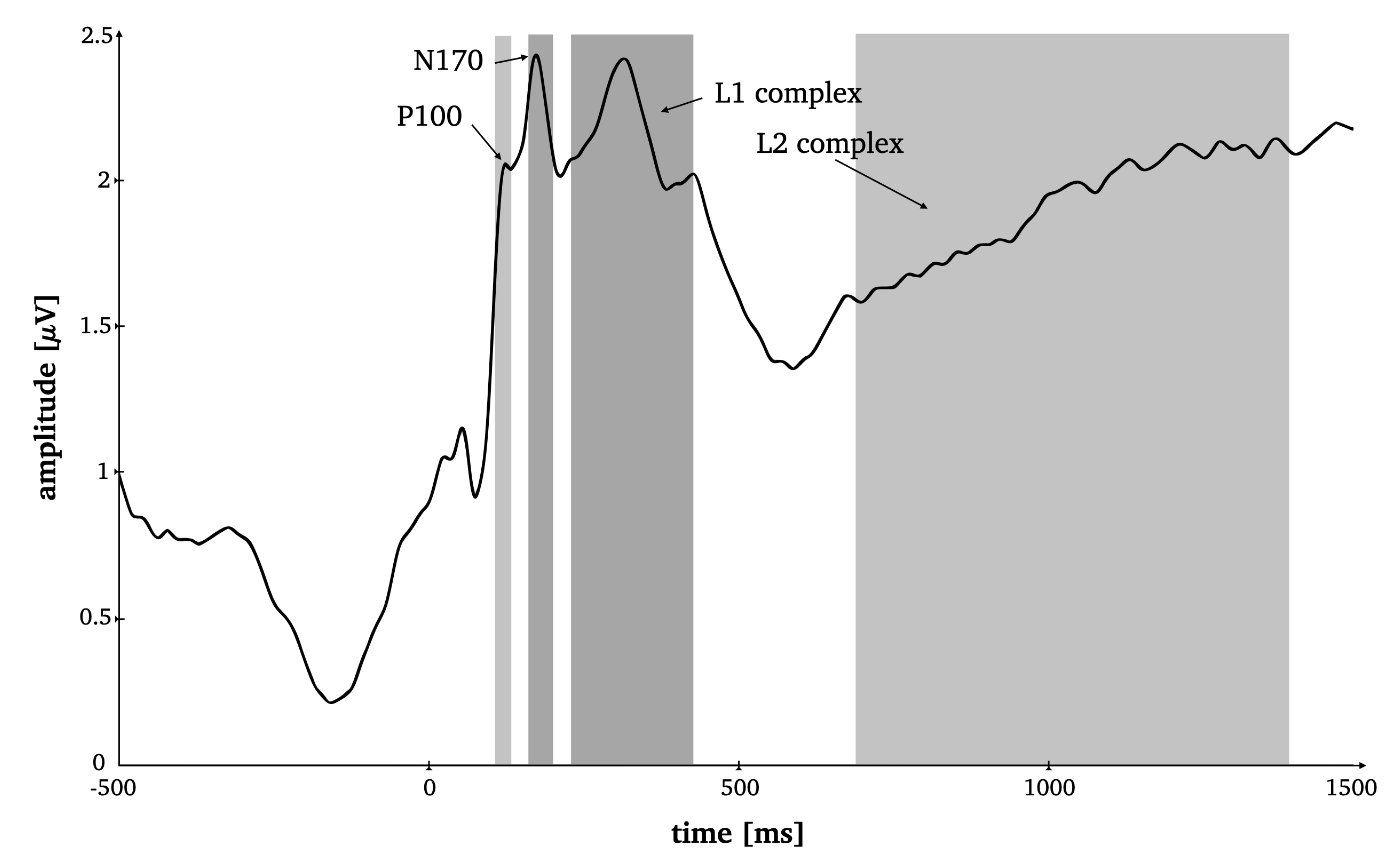
FIG. 2. Time-by-amplitude plot of the root mean squared ERP averaged over all electrodes for the selection of appropriate time windows for all ERP components. Grey highlighted sections mark the time windows for P1 (95–125ms), N170 (165–195ms), L1 (230–420ms) and L2 (685–1,385ms).
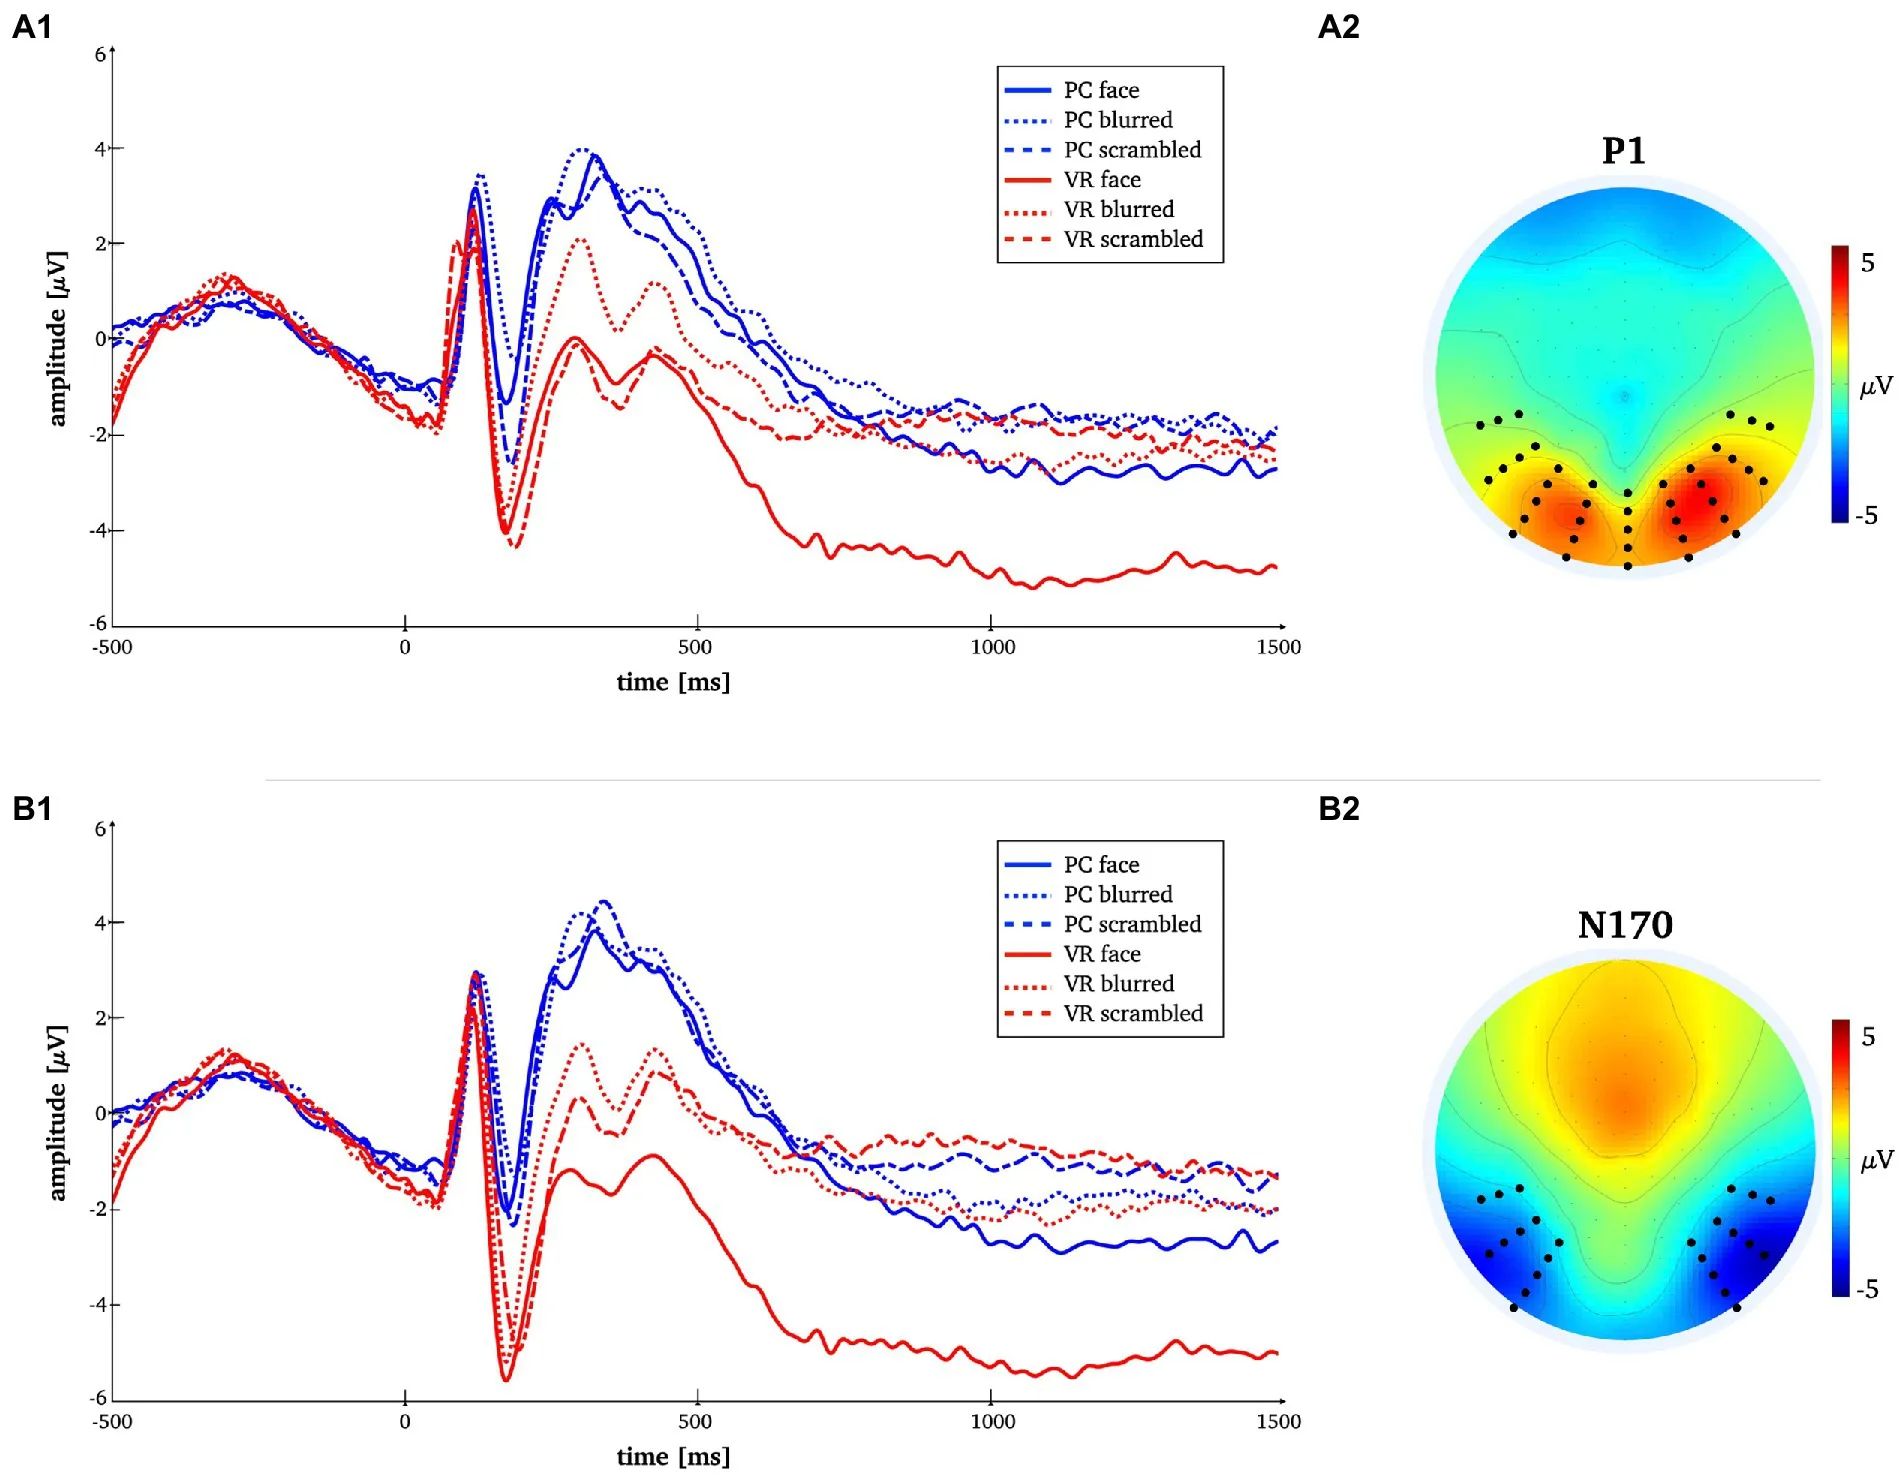
Fig. 3. Time-by-amplitude plot of the mean P1 and N170 amplitudes for all conditions (panels A1, B1). Mean topographies across conditions used for ERP averaging (panel A2, B2). The electrodes selected for analyses are indicated. For the P1 electrodes Oz, O1, O2, P7, PO7, P8, PO8, TP7, TP8 and those in close vicinity were used. For the N170 electrodes P7, P8, PO7, PO8, P10, P9, PO10, PO9, TP7, TP8 and those in close vicinity were used.
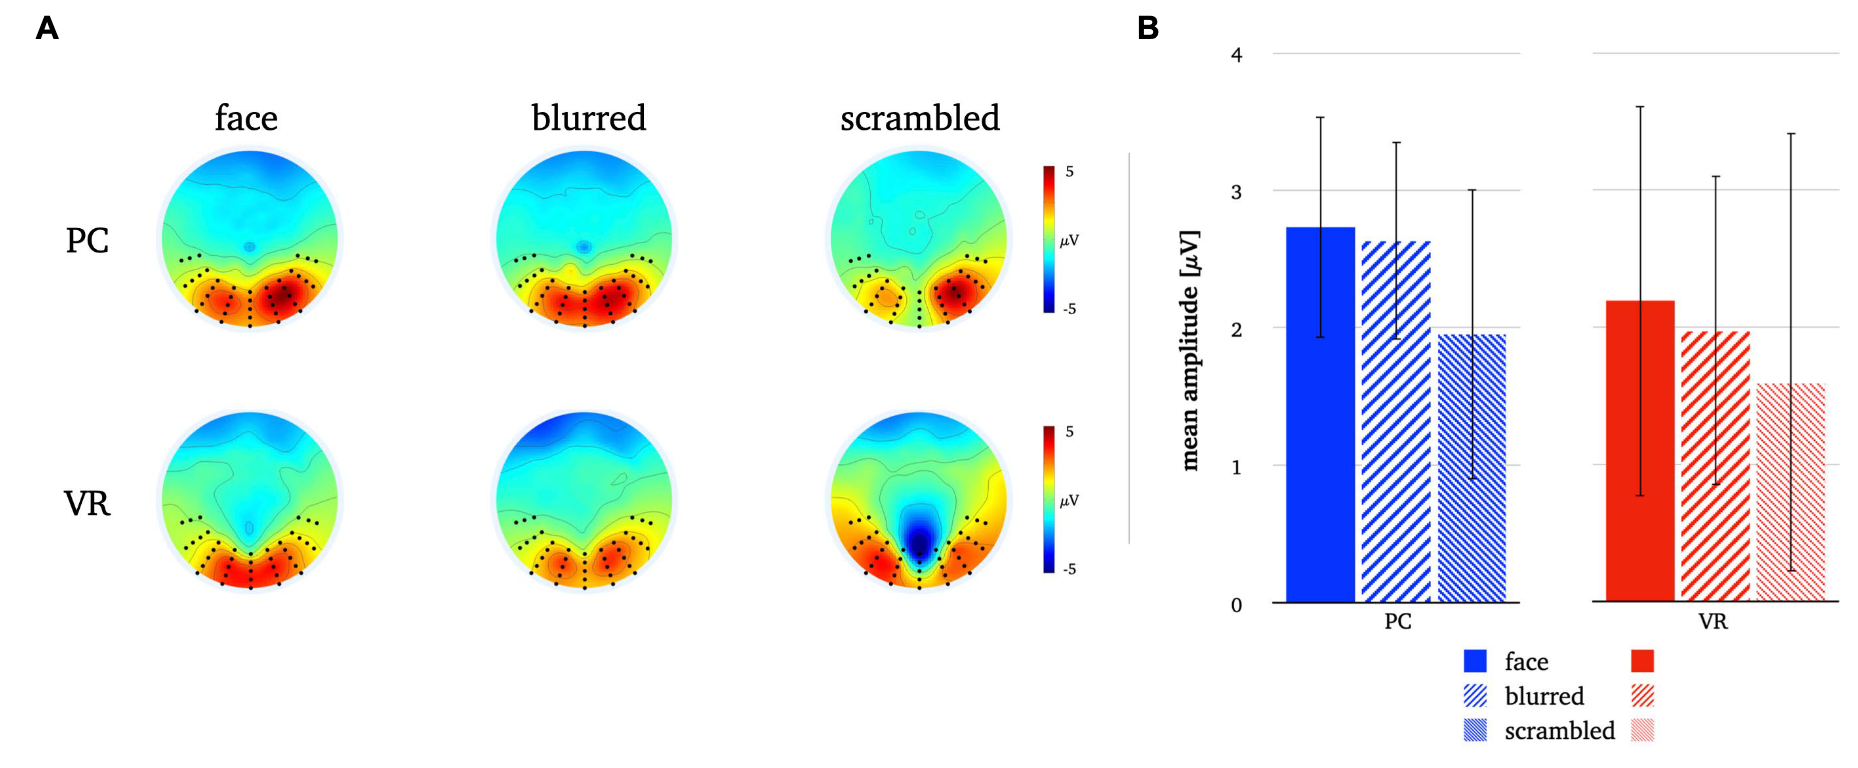
FIG. 7. Panel A illustrates the P1 topographies for all stimulus types in both modalities. Panel B depicts the mean P1 amplitudes for all stimulus types in both modalities. The error bars depict the confidence intervals for the mean values. Significant differences within each modality are marked (p<0.05).
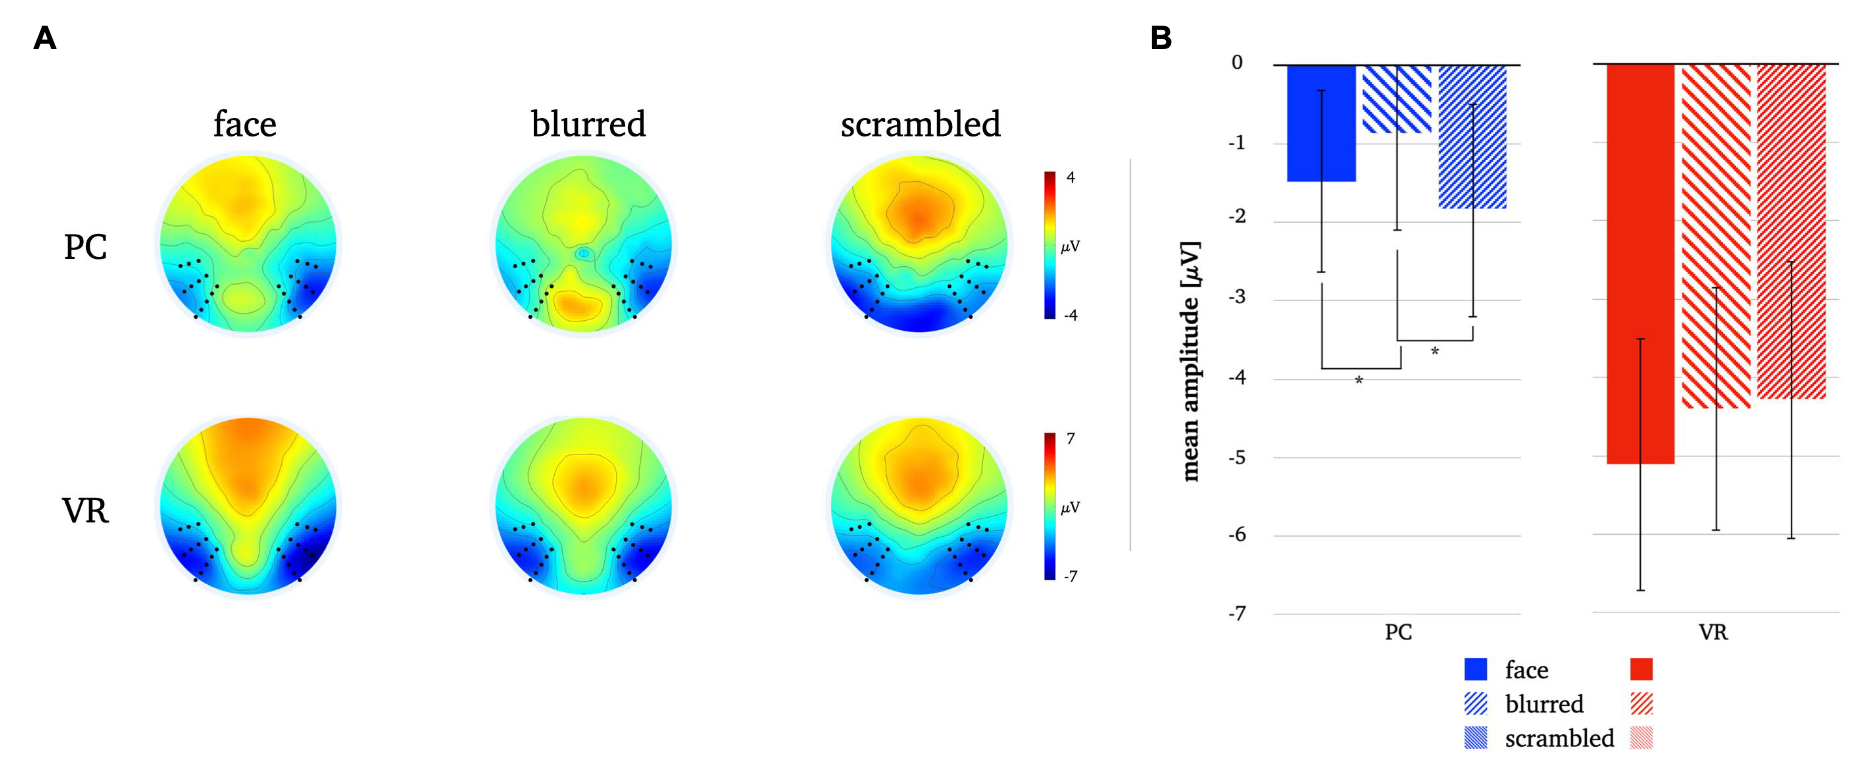
FIG. 8. Panel A illustrates the N170 topographies for all stimulus types in both modalities. Panel B depicts the mean N170 amplitudes for all stimulus types in both modalities. The error bars depict the confidence intervals for the mean values. Significant differences within each modality are marked (p<0.05).
Extending previous laboratory studies, later components reflect said mechanisms of realistic face processing. In contrast to earlier components, later potentials are linearly related to stimulus realism (Schindler et al., 2017), modulated by socially relevant emotional expressions and affective contexts (Bublatzky et al., 2014; Stolz et al., 2019) and especially sensitive for self-related emotions (Herbert et al., 2013).
Processing of actually self-relevant emotional and contextual information, such as, e.g., threat towards oneself, seems to not be captured by the N170 component.
Thus, consistent with laboratory results, late components discriminate faces and controls under realistic conditions, as they exhibiting much more discriminatory potential than the N170.
source: https://www.frontiersin.org/articles/10.3389/fpsyg.2023.1050892/full